Project thoughts
Introduction:
Economic uncertainty has long been believed to affect how people think about politics; however, there is no evidence to confirm whether financial uncertainty causes individuals to shift their views from left to right. The purpose of my research is to determine if increased financial concern affects where an individual places themselves ideologically on a left-right continuum in relation to other U.S. citizens. The reason why this research is so important is due to the fact that many people have experienced financial struggles at some point in time. Therefore, if those who have felt financially vulnerable are consistently placing themselves on the right end of the left/right continuum, then we can possibly understand why people act in certain ways politically and vote for specific candidates.
My hypothesis is that individuals with greater financial concerns will be placed further to the right of the left-right continuum. One way to explain the relationship between economic fear (financial insecurity) and conservatism is by referring to economic fear/ threat response theories. According to these theories, when someone feels economically insecure they want to maintain order, stability and familiarity within the society. These traits are typically attributed to conservatives. Therefore, if my thesis is correct, individuals who report higher levels of financial concern should place themselves closer to the right end of the left/right continuum than others.
Data:
I will draw on the results of the 2024 American National Election Studies (ANES) Time Series Study. This is a national survey that focuses on adult residents of the United States regarding their political beliefs, political ideologies, and demographic factors. The ANES 2024 study employed a mixed mode format and included multiple sample types; however, in this analysis I am utilizing pre-election survey responses in a cross-sectionally designed observational framework. In other words, I am looking at responses by individual respondents who contribute one response each to the data set; thus, there are no experimental designs or panel changes used in collecting this data.
The dependent variable of interest is the respondents’ reported ideological self placement. Ideological self-identification was assessed via “V241177,” a 7 point scale measuring from 1 = extremely liberal to 7 = extremely conservative. I excluded respondents whose reports were invalid or not substantive. The primary independent variable of concern is whether respondents currently experience worry over their finances. Financial worry is being assessed through “V241539,” where respondents reported how worried they were with their current financial situation, and possible responses ranged from extremely worried to not at all worried. Therefore, I have reversed “V241539” so that greater values represent more worry over financial situations. Evidence supporting the hypothesis would be evidence of a statistically significant positive association between financial worry and ideology. This means that if respondents reported having increased financial worries, then it could be expected that such respondents also would place themselves further right on the 7 point ideological self identification scale. A lack of association between these two variables or a negative association would suggest either a weakening or rejection of the hypothesis.
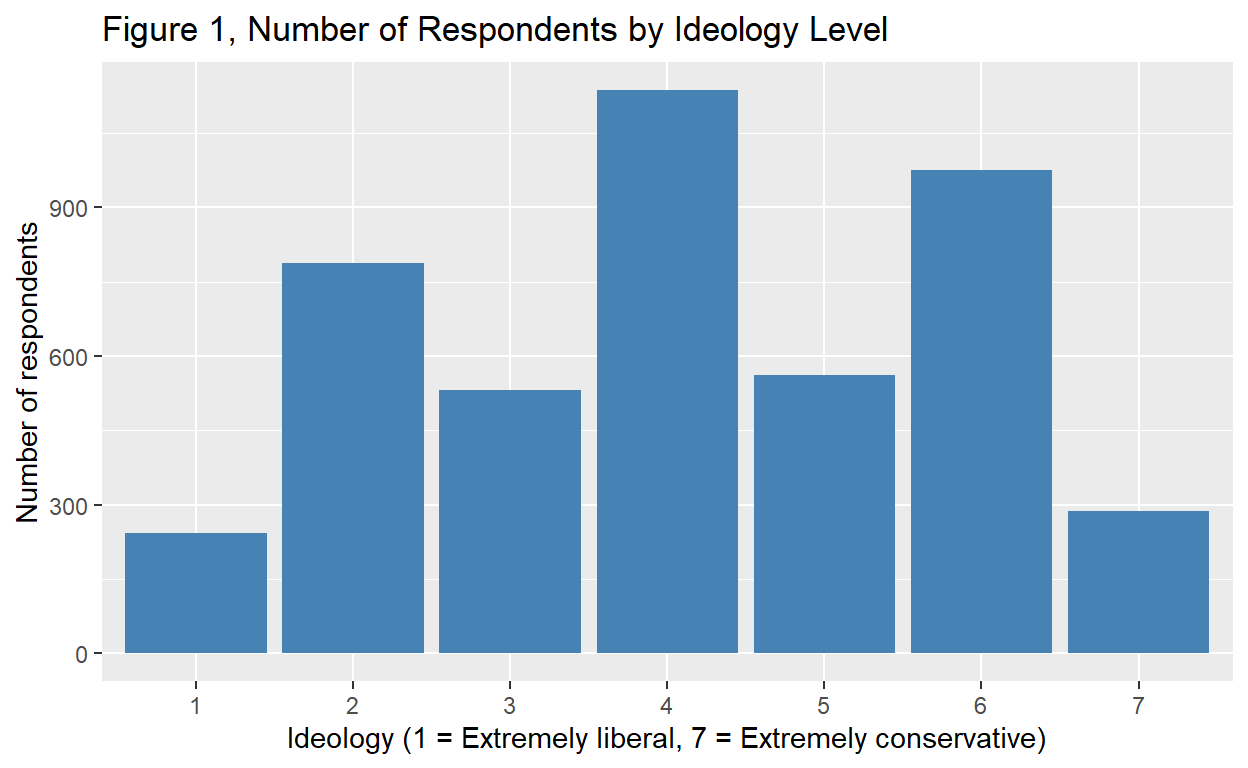
Figure 1 shows the distribution of the dependent variable, ideological self-placement.
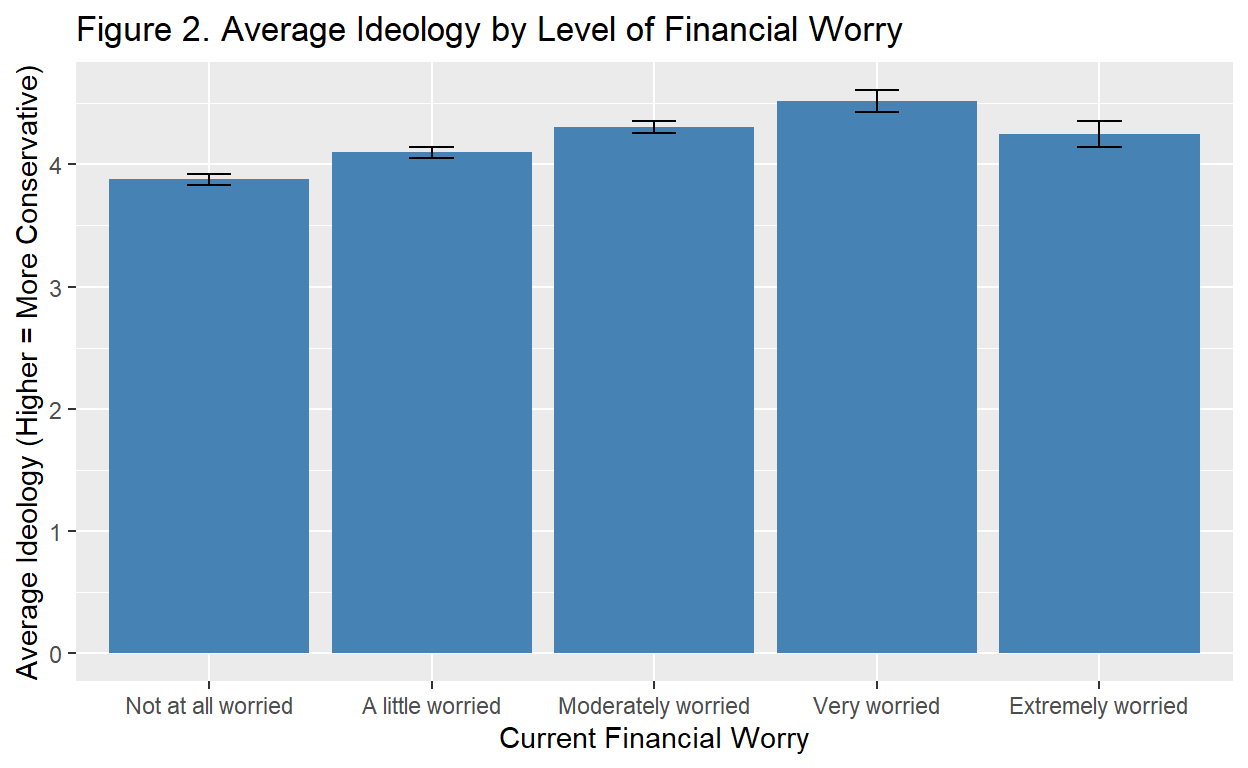
Figure 2 shows the relationship between financial worry and ideological self-placement. Respondents who report higher levels of financial worry also report slightly more conservative ideological positions on average. The pattern is gradual rather than dramatic, but its direction is consistent with the hypothesis that economic insecurity is positively associated with conservative ideology.
| Estimate | Std. Error | t value | p value | |
|---|---|---|---|---|
| (Intercept) | 3.776 | 0.055 | 68.337 | 0 |
| fin_worry_rev | 0.152 | 0.022 | 6.960 | 0 |
Analysis:
The value for the financial worry variable (coefficient) is 0.152; therefore, a one-unit increase in financial worry is associated with approximately a 0.15-point increase in a respondent’s identification on the seven point ideology measure. That being said, those individuals with higher levels of financial concern will have slightly increased likelihood of identifying themselves as slightly more conservative.
As indicated by p < 0.001, the relationship is statistically significant suggesting that the relationship observed here likely has nothing to do with chance in this data set. However, at the same time, the relationship between financial worry and ideology has a relatively small substantive size. Therefore, while financial worry does appear to be important, it is clear that there are many other factors contributing to a person’s ideological placement.
Due to the nature of the study using a cross-sectional observational research design, I am unable to use this coefficient to imply a causal relationship between financial worry and ideology. There could be omitted variables such as educational attainment, age, income, and/or prior partisan affiliation that cause both financial worry and ideology. Alternatively, there could be some type of circular relationship where an individual’s political beliefs affect their interpretation of their own economic status.
| Estimate | Std. Error | t value | p value | |
|---|---|---|---|---|
| (Intercept) | 2.739 | 0.077 | 35.487 | 0.00 |
| fin_worry_rev | -0.056 | 0.024 | -2.320 | 0.02 |
| fin_change | 0.479 | 0.026 | 18.569 | 0.00 |
As a robustness check, I added a second predictor (V241451) measuring whether respondents report being financially better or worse off than they were a year ago. This lets me separate two distinct components of economic insecurity: present-tense worry and perceived retrospective decline. The results in Table 2 substantially change the interpretation. The coefficient on retrospective financial decline is large and highly significant (b = 0.479, p < 0.001) — respondents who report being worse off than last year place themselves notably further to the right. More strikingly, once decline is held constant, the coefficient on current financial worry flips sign (b = −0.056, p = 0.02). In other words, the positive bivariate association in Table 1 appears to have been driven largely by retrospective decline rather than by present worry itself. Among respondents whose financial situation has been stable, those reporting more current worry are, if anything, slightly more liberal. This pattern weakens the original hypothesis as stated and points toward a more specific claim: it is the direction of change in financial circumstances, not the level of worry, that tracks conservative ideology in this data.
Conclusion:
The results provide qualified, partial support for the hypothesis. In the simple bivariate regression, financial worry is positively and significantly associated with conservative self-placement, consistent with economic-threat theories of ideology. However, once I control for perceived retrospective financial decline, the relationship between current worry and conservatism reverses sign, and decline itself emerges as the substantively important predictor. This suggests that the original hypothesis — framed in terms of “financial worry” generally — conflates two distinct constructs that have opposite associations with ideology once disentangled.
Several limitations qualify these conclusions. First, the design is cross-sectional and observational, so I cannot rule out confounding from variables I did not include — education, age, income, race, region, and prior partisan attachment all plausibly influence both economic perceptions and ideological self-placement. Second, both key variables are self-reported, which raises the possibility of reverse causation: a respondent’s existing political identity may shape how they characterize their own financial situation, particularly under a presidential administration they support or oppose. Third, ideology is collapsed onto a single 7-point left-right scale, which obscures the multidimensional nature of political belief (e.g., someone economically left and socially right). Fourth, ANES respondents are not a perfectly representative slice of the population, and item non-response may not be random with respect to either variable.
The analysis could be improved in several ways. Panel data following the same respondents across years would allow within-person fixed-effects models that absorb time-invariant confounders like personality and upbringing. Objective economic measures — actual income changes, unemployment spells, or county-level economic shocks linked to respondents — would reduce reliance on subjective self-reports and the reverse-causation concern they create. A natural experiment, such as a localized plant closure or a recession shock, would more credibly isolate the effect of economic insecurity on ideology. Finally, replacing the single ideology scale with separate measures of economic and social ideology would test whether financial insecurity moves these dimensions differently — a distinction that the current analysis cannot detect.
library(tidyverse)
anes <- read.csv("data/anes_timeseries_2024_csv_20250808.csv")

proj_data <- anes |>
  select(V241177, V241539) |>
  mutate(
    ideology = as.numeric(V241177),
    fin_worry = as.numeric(V241539),
    fin_worry_rev = 6 - fin_worry
  ) |>
  filter(
    ideology >= 1 & ideology <= 7,
    fin_worry >= 1 & fin_worry <= 5
  )

plot_data <- proj_data |>
  group_by(fin_worry_rev) |>
  summarize(
    mean_ideology = mean(ideology),
    se = sd(ideology),
    n = n()
  )
ggplot(proj_data, aes(x = factor(ideology))) +
  geom_bar(fill = "steelblue") +
  labs(
    x = "Ideology (1 = Extremely liberal, 7 = Extremely conservative)",
    y = "Number of respondents",
    title = "Figure 1, Number of Respondents by Ideology Level"
  )
ggplot(plot_data,aes(
  x = factor(
      fin_worry_rev,
      levels = 1:5,
      labels = c(
        "Not at all worried",
        "A little worried",
        "Moderately worried",
        "Very worried",
        "Extremely worried"
      )
    ),
    y = mean_ideology)) +
  geom_col(fill = "steelblue") +
  geom_errorbar(aes(ymin = mean_ideology - se/sqrt(n),
                    ymax = mean_ideology + se/sqrt(n)),
                    width = 0.2) +
  labs(
    title = "Figure 2. Average Ideology by Level of Financial Worry",
    x = "Current Financial Worry",
    y = "Average Ideology (Higher = More Conservative)"
  )
fit_1 <- lm(ideology ~ fin_worry_rev, data = proj_data)

reg_table <- fit_1 |>
  summary() |>
  coef()

knitr::kable(reg_table,
             digits = 3,
             col.names = c("Estimate", "Std. Error", "t value", "p value"),
             caption = "Regression of ideology on financial worry")
robust_data <- anes |>
  select(V241177, V241539, V241451) |>
  mutate(
    ideology = as.numeric(V241177),
    fin_worry = as.numeric(V241539),
    fin_worry_rev = 6 - fin_worry,
    fin_change = as.numeric(V241451)
  ) |>
  filter(
    ideology >= 1 & ideology <= 7,
    fin_worry >= 1 & fin_worry <= 5,
    fin_change >= 1 & fin_change <= 5
  )

fit_2 <- lm(ideology ~ fin_worry_rev + fin_change, data = robust_data)

robust_table <- fit_2 |>
  summary() |>
  coef()

knitr::kable(
  robust_table,
  digits = 3,
  col.names = c("Estimate", "Std. Error", "t value", "p value"),
  caption = "Regression including an additional measure of financial decline"
)